
Credit ratings, default rates and yield curves are traditionally analysed through tables, charts and dashboards. At today’s session of the iff Immersive Finance Forum, Dr. Oliver Everling and Christian Spiekermann demonstrated how three-dimensional visualisation and Virtual Reality can bring these relationships together in a shared spatial environment.
Under the title “Immersive Analytics for Finance”, the approximately 80-minute session combined presentations, live demonstrations and discussion entirely in Virtual Reality. Participants explored how financial data can move beyond the two-dimensional screen—from credit risk and rating structures to ownership networks and interest-rate landscapes.
The session took place on the collaborative platform Arthur using Meta Quest headsets. Following the forum’s launch in August, it was the first session with a full specialist programme.
Credit Ratings Are Multidimensional
Dr. Oliver Everling, Managing Director of RATING EVIDENCE GmbH, placed immersive analytics in the context of credit analysis. Ratings are inherently multidimensional: capitalisation, profitability, liquidity, asset quality, leverage, governance and market conditions must be assessed in combination rather than isolation.
Bank ratings illustrate the challenge particularly well. The CAMEL framework covers Capital Adequacy, Asset Quality, Management, Earnings and Liquidity, each of which can contain numerous underlying indicators.
According to Everling, conventional screens often force analysts to distribute these relationships across multiple tables and charts. Three-dimensional environments offer the possibility of examining several dimensions simultaneously.
Walking Through Credit Risk
One of the central demonstrations translated rating classes from AAA to C and maturities from one to ten years into a three-dimensional environment.
Individual objects represented combinations of credit quality and maturity. Their size reflected interest volumes, while their fill level visualised historically observed default risk. The result was a walkable representation of the relationship between ratings, maturity, default probability and risk premium.
Rather than comparing separate rating tables, default studies and yield curves, participants could explore these dimensions within a single model.
The approach is particularly relevant for portfolio management and credit risk discussions. Rating migration, concentrations of lower-rated exposures and the relationship between maturity and risk can potentially be visualised as movements and patterns within the same financial landscape.
From Yield Curves to a Yield Mountain
Interest rates formed another major focus of the session.
A conventional yield curve shows the relationship between maturity and yield at a particular point in time. Adding time as a further dimension produces a much more complex picture.
The yield mountain demonstrated at the forum transformed this data into a three-dimensional landscape. Maturity and time formed two dimensions, while the level of interest rates created the third. Negative interest rates, market shocks and periods of yield curve inversion became visible as valleys, ridges and changes in the landscape.
The concept becomes particularly powerful when combined with credit ratings. Bond yields are influenced not only by maturity but also by credit quality. Differences in expected default risk, loss severity, liquidity and market perception contribute to credit spreads and risk premiums.
A spatial model can therefore connect the key dimensions of fixed-income analysis: benchmark rates, maturities, ratings, historical default experience and the compensation investors require for taking credit risk.
Default Rates in Context
Historical default rates are an important empirical reference point for credit analysis, but conventional tables often present them in isolation.
Immersive visualisation can place default experience in context. Participants can examine how observed risk changes across rating categories and maturities and how these changes relate to interest-rate compensation.
The purpose is not to replace statistical models or rating methodologies. Instead, spatial visualisation can support professional judgement by making relationships between the underlying variables easier to inspect.
Ownership Structures and Credit Analysis
The session also demonstrated how three-dimensional visualisation can help analyse corporate ownership structures.
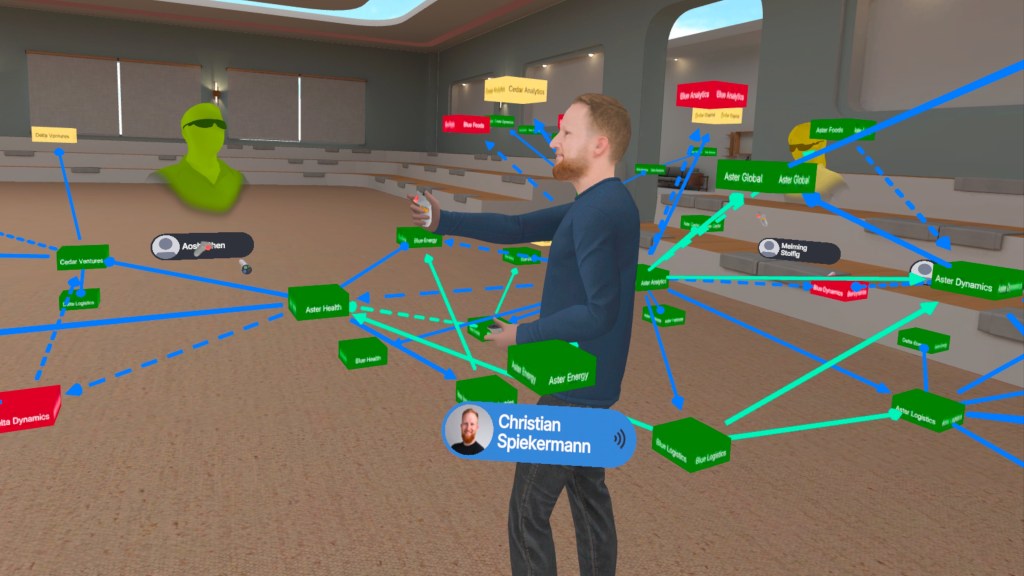
Everling referred to the BusinessGraph of Palturai GmbH, which maps economic relationships using commercial registers and other public sources. Tracing beneficial ownership through several levels can quickly produce diagrams that become difficult to read on even large screens. One example discussed during the presentation extended through eleven ownership levels.
In the immersive model, entities were represented as cuboids and relationships as connecting edges. Colours indicated corporate status, while different line types distinguished active and historical relationships.
For credit analysis, such structures can be highly relevant. Ownership, guarantees, dependencies and relationships between group entities may all affect the assessment of a borrower’s financial position and risk profile.
AI Prepares, Humans Decide
Artificial intelligence will increasingly accelerate both ownership research and financial analysis. It can search large datasets, identify relationships, process financial information and prepare preliminary assessments.
Everling’s argument was that faster answers do not eliminate the need for human understanding. Knowing who owns a company, for example, is different from understanding the wider network of relationships and dependencies surrounding that company.
The same applies to credit analysis. AI can estimate and organise risk, but analysts and decision-makers must still interpret the relationships between ratings, default probabilities, maturities and market prices.
The division of labour presented at the forum was therefore straightforward: AI prepares information and supports analysis; humans make decisions. Immersive environments may increasingly become places where those decisions are discussed with multiple factors visible at the same time.
Bringing the Real World into the Analysis
Another highlight was Spatial Link, an application developed by Christian Spiekermann. Using the passthrough capabilities of a Quest headset, the application allows participants to share and explore a real environment in three dimensions.
Everling described an early test in which Spiekermann appeared virtually in his study, looked around the room and was even able to read a wall thermometer.
The financial applications extend to virtual site inspections for corporate valuations and real estate transactions. The discussion also covered insurance risk inspections and remote claims assessment. LIDAR technology could allow industrial facilities and other physical assets to be captured as walkable three-dimensional models.
Such applications may be particularly valuable where physical assets and operational conditions form part of the credit or investment assessment.
A Shared Financial Landscape
Participants also contributed examples of their own immersive projects, including walkable portfolio timelines and the three-dimensional visualisation of Bundesbank yield data.
The key advantage is not necessarily more information. Rather, it is a different way of engaging with the same information.
Instead of discussing a chart on a shared screen, participants can gather around a financial model, explore an anomaly together and examine relationships from different perspectives.
Thanks to the Supporters of the Forum
Everling expressed his particular gratitude to Martin Bloos, Deputy Chairman of the eff European Finance Forum, for joining the session. The iff Immersive Finance Forum is closely inspired by the eff model, which has provided an important conceptual example for combining professional expertise, exchange and networking.
Further thanks went to Gerald Kottmann of Alice to Bob GmbH for sponsoring the event and supporting the initiative. Everling also thanked Christian Salow of altii GmbH in particular for taking responsibility for the complete organisation and implementation of the meeting in Arthur on Meta Quest.
Their contributions helped transform the idea of an immersive finance forum into a functioning professional event in Virtual Reality.
The Financial Analyst’s Workplace in Three Dimensions
Everling concluded with a broader perspective: the workplace of the financial analyst may increasingly become three-dimensional.
The Data2Space initiative behind the presentation does not seek to create another proprietary platform. Instead, it explores how financial and corporate data can be transferred into interactive environments that support analysis and decision-making.
For credit ratings, the potential is particularly clear. Rating classes, historical default rates, maturity structures, credit spreads and interest-rate developments can be connected within the same spatial model. Ownership structures and other qualitative factors can add further dimensions.
Immersive Analytics therefore does not replace ratings, statistical models or conventional financial analysis. It adds another way of understanding the relationships between them.
At today’s iff Immersive Finance Forum, credit ratings, default rates and yield curves were no longer merely displayed on a screen.
They became part of a shared financial landscape.
The next session of the iff Immersive Finance Forum will take place on Tuesday, October 13, 2026, at 6:30 p.m., again in Arthur on Meta Quest, with Christian Salow, Managing Director of altii GmbH, as the scheduled speaker.



















Leave a comment