

Today marks the online launch of Data2Space, a new service designed to change the way complex financial and business information is visualized, explored, and communicated. Instead of limiting data analysis to spreadsheets, charts, dashboards, and two-dimensional diagrams, Data2Space introduces a spatial dimension: data can become an interactive environment.
Data2Space positions itself at the intersection of finance, data analytics, 3D visualization, and Extended Reality. Its central proposition is straightforward: “Turn Data into Space.”
From Data Visualization to Data Spaces
Traditional data visualization is highly effective when the underlying information can be represented through tables, graphs, or conventional dashboards. However, financial and corporate structures can become difficult to understand when hundreds or thousands of relationships have to be considered simultaneously.
Ownership structures are a good example. A company may own several subsidiaries, which in turn hold investments in other companies. Investors may have direct and indirect interests, while cross-shareholdings and different forms of influence create additional layers of complexity.
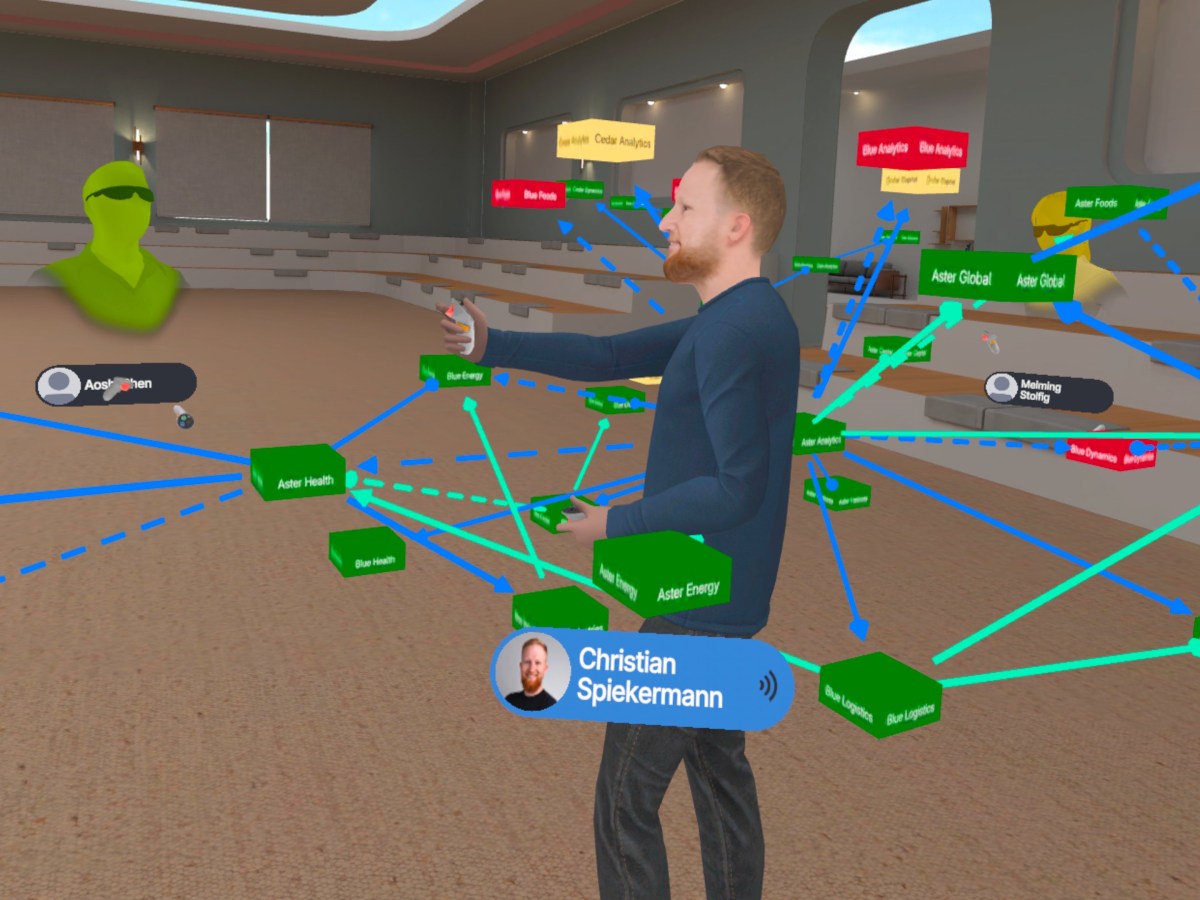
Data2Space addresses this problem by treating relationships as spatial information. Instead of looking at an ownership network as a flat diagram, users can explore it as a three-dimensional structure and change their perspective on the information.
Spatial Computing for Finance
The concept becomes particularly relevant in finance because financial information is inherently relational.
Questions such as who owns a company, who controls an asset, where risks are concentrated, which investors are connected, or how an investment portfolio is structured can be understood as relationships within a network.
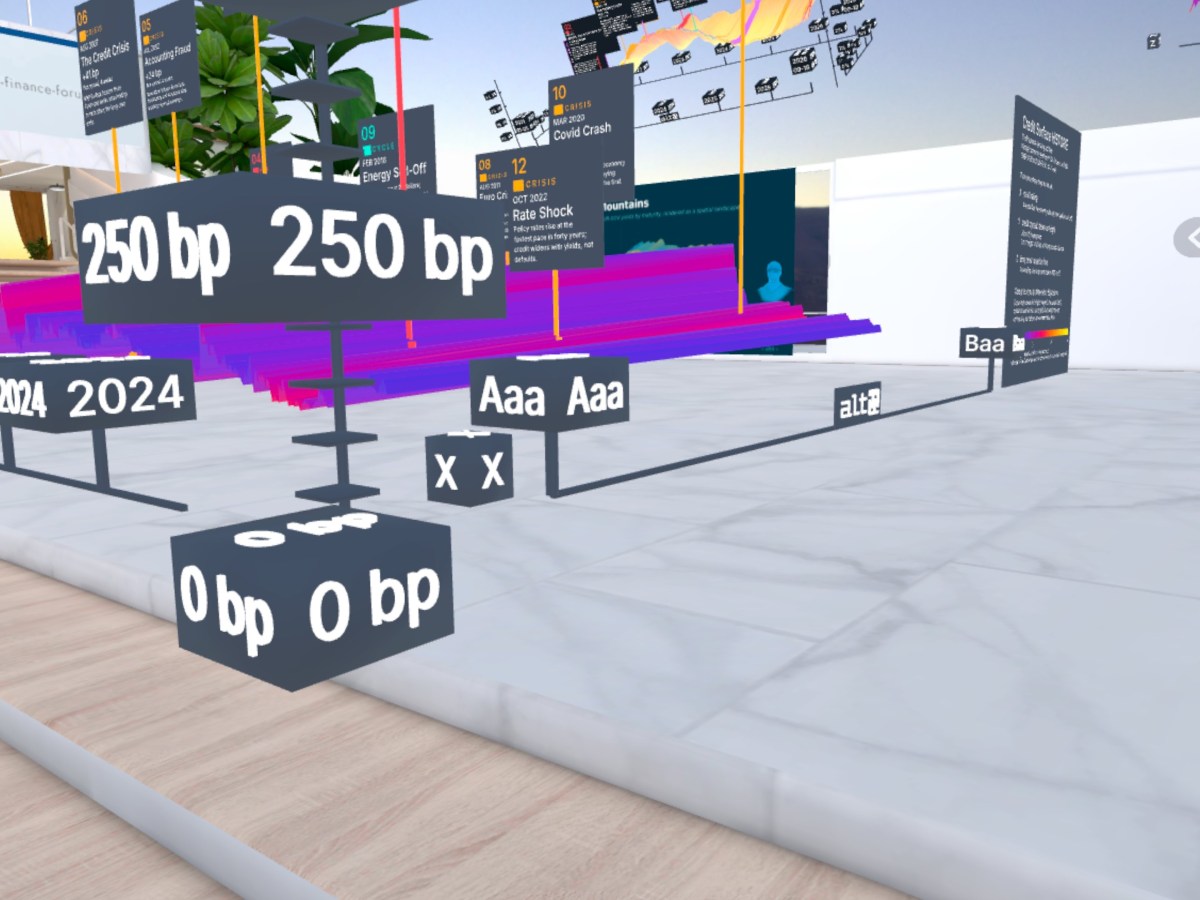
Three-dimensional visualization adds another dimension to this network. Objects can represent companies, assets, investors, financial instruments, or other entities, while spatial connections represent economic relationships.
The objective is not simply to make financial information look more attractive. The spatial representation is intended to support cognition: users can move around information, identify structures, focus on individual elements, and examine relationships from different perspectives.
From Dashboards to Immersive Analytics
Data2Space describes its approach as “Immersive Analytics for Finance.” This reflects an important distinction from conventional business intelligence.
A dashboard generally presents information to the user. An immersive environment can allow the user to enter the information structure itself.
This distinction becomes particularly interesting when dealing with complex networks. Instead of navigating through multiple screens or repeatedly filtering tables, users can potentially explore the same information through spatial interaction.
The result is a different relationship between analyst and data. Data becomes something that can be explored rather than merely displayed.
Three Perspectives on the Data
Data2Space presents its applications around three broad ideas: “Grasp your Data,” “Explore your Product,” and “Tell your Story.”
“Grasp your Data” focuses on understanding complex information and relationships. This could include corporate structures, investment portfolios, ownership networks, or other financial datasets.
“Explore your Product” addresses the presentation of financial products and investment opportunities through interactive three-dimensional environments.
“Tell your Story” focuses on communication. Rather than presenting a sequence of conventional slides, companies and financial professionals can use spatial environments to explain structures, products, strategies, and relationships.
This creates opportunities not only for analysis but also for investor communication, education, consulting, and presentations.
A New Medium for Complex Corporate Structures
One of the most promising areas is the visualization of ownership and influence structures.
Corporate networks can quickly become difficult to interpret when direct and indirect ownership, subsidiaries, investors, and other relationships are combined in a single diagram. A spatial representation can introduce additional degrees of freedom for organizing this information.
Companies could be positioned according to ownership, geography, industry, size, risk, or other analytical criteria. The resulting environment could therefore become more than a visualization: it could function as an interactive analytical model.
This is particularly relevant for areas such as M&A, investment analysis, corporate research, credit analysis, and due diligence.
Collaboration in an Information Space
Another important aspect of Data2Space is collaboration.
Financial analysis is rarely an entirely individual activity. Analysts, investors, consultants, managers, and other stakeholders often need to examine the same information and reach a common understanding.
A shared three-dimensional environment can provide a common spatial reference. Participants can examine the same structure, focus on individual entities, discuss relationships, and develop a shared interpretation of the underlying data.
In this sense, Data2Space is not only about visualization. It also points toward a new form of collaborative financial analysis.
Beyond Gaming and Entertainment
Spatial computing is frequently associated with gaming, virtual worlds, and entertainment. Data2Space explores a different direction: professional applications where spatial interaction can provide analytical value.
Finance is particularly suitable for this approach because its objects and relationships are largely abstract. A company, a bond, a portfolio, an ownership stake, or a risk exposure has no physical form. Digital space can therefore provide a new way of representing these abstract objects.
The potential is especially significant when conventional two-dimensional representations become overloaded.
An Additional Layer for Digital Information
Data2Space does not need to replace established financial systems, databases, spreadsheets, or business-intelligence platforms. Instead, its role can be understood as adding a spatial layer to existing digital information.
The underlying data remains the foundation. Data2Space changes how that information can be perceived, navigated, and communicated.
This distinction is strategically important. The future of immersive finance will depend not simply on producing impressive 3D environments, but on connecting those environments to reliable, structured, and analytically meaningful data.
From Numbers to Structures
The launch of Data2Space therefore represents more than the introduction of another visualization tool.
It reflects a broader shift in thinking about how digital information can be presented. For decades, financial information has primarily been organized in tables, charts, documents, and dashboards. The emergence of spatial computing makes another question possible: What if complex information could be organized as a space?
For financial professionals, the answer could be particularly valuable. When data consists of thousands of relationships, understanding the structure may be just as important as knowing the individual numbers.
Data2Space takes this idea as its starting point. Its ambition is to transform data into interactive spaces in which complex relationships can be seen, explored, analyzed, and communicated.
The launch today is therefore a step toward a new category of financial technology: immersive analytics in which the spatial dimension becomes part of the analytical process itself.

















Leave a Reply