

The novelty of Data2Space is not simply that financial data can be displayed in three dimensions. 3D visualization has existed for decades, and virtual reality has already been used in a variety of professional applications. What is new about Data2Space is the combination of spatial data representation, interactive analysis, collaboration and hardware-independent access in a single environment for complex financial and corporate information.
Data2Space starts from a fundamental observation: the problem with modern financial information is increasingly not a lack of data, but the fragmentation and complexity of that data. Reports, spreadsheets, databases, presentations and other information sources are usually examined separately. Even sophisticated business-intelligence systems generally present information through screens, dashboards and documents. Data2Space proposes a different model: bring interconnected information together into a shared spatial environment.
From Documents to Information Spaces
The conventional workflow of financial analysis is largely document-centric. An analyst opens a report, switches to a spreadsheet, consults a database, returns to the report and perhaps opens another application to investigate an ownership relationship or transaction.
Data2Space changes the basic metaphor. Instead of moving between documents, users move through an information space.
This is an important conceptual difference. A company, an ownership stake, a transaction, a financial instrument or an asset can become an object within a spatial information model. Relationships between these objects can be represented visually and explored interactively.
The user is therefore no longer limited to asking which document contains the relevant information. The question becomes where the relevant information is located within the overall structure and how it relates to everything else.
The Third Dimension Becomes Analytical
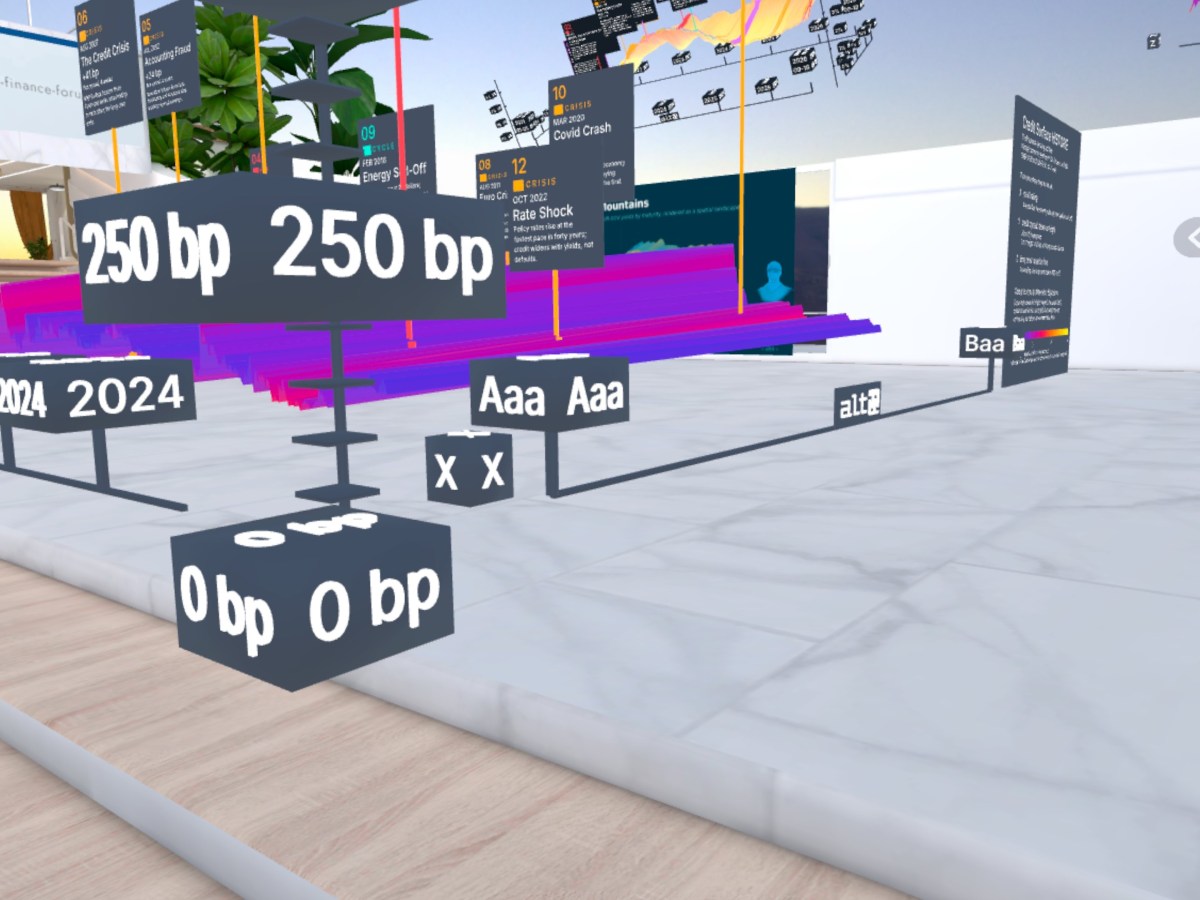
The use of three dimensions is not an end in itself. Its analytical value lies in the additional possibilities for organizing information.
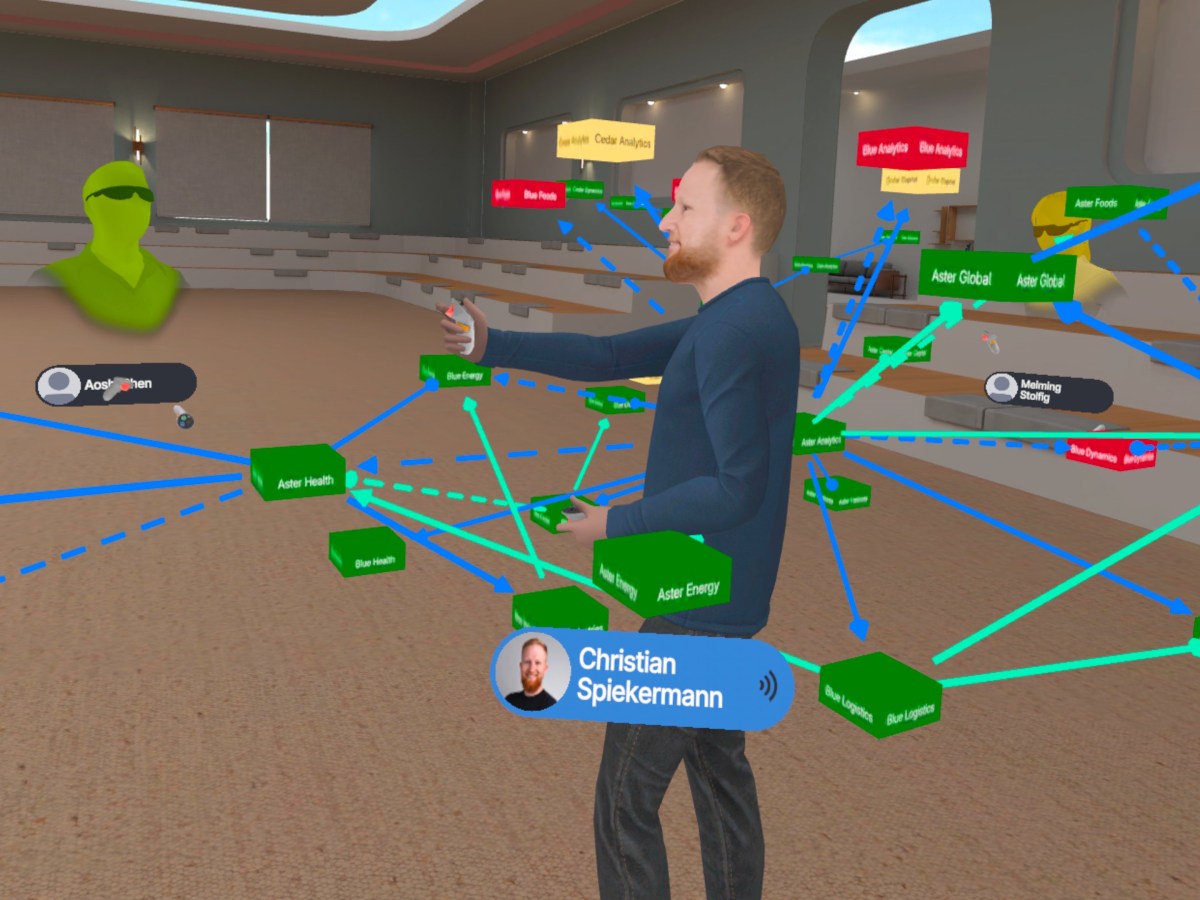
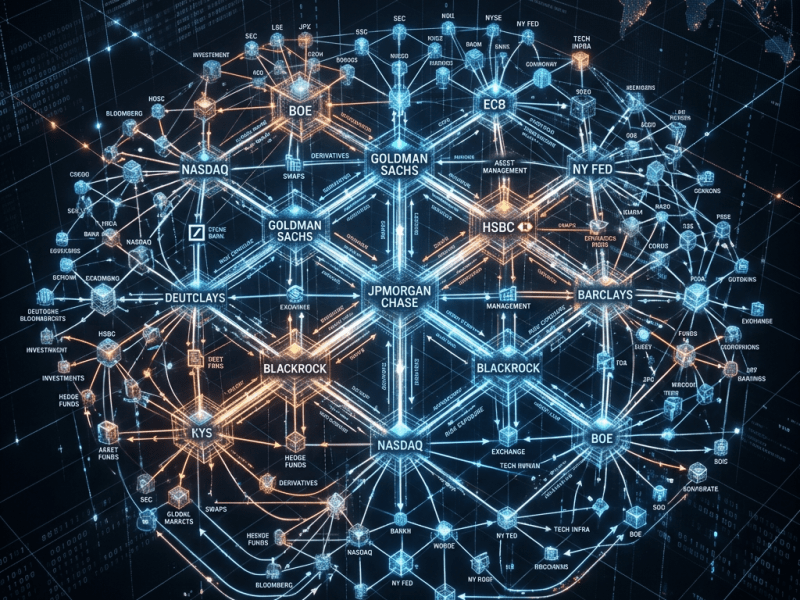
A large ownership network, for example, can be arranged so that users can first see the overall structure and then move toward individual companies or relationships. Information can be filtered, highlighted, compared and examined at different levels of granularity.
This creates a form of semantic navigation. The user does not merely scroll through information; the user navigates through relationships.
That distinction becomes increasingly important as datasets become larger and more interconnected. In a conventional diagram, adding more information often makes the visualization more difficult to read. In a spatial environment, additional dimensions and interaction mechanisms can be used to separate, group and explore information.
From Visualization to Exploration
Traditional visualization generally follows a presentation logic: data is processed and then displayed in a chart, graph or dashboard.
Data2Space introduces an exploration logic. Users can interact with the information environment, change their viewpoint, zoom from an overview into details, apply filters, highlight relationships and examine alternative scenarios.
This means that the visualization is no longer necessarily a fixed output generated by an analyst. It becomes an interactive analytical instrument.
The distinction is particularly relevant for due diligence. A conventional due-diligence process involves collecting and reviewing large quantities of documents and datasets. A spatial representation can provide an additional layer in which the structure represented by those documents becomes directly explorable.
Digital Twins as Analytical Objects
Another significant innovation is the use of digital twins for financial and corporate analysis.
A digital twin does not have to represent a physical machine or building. In the Data2Space context, it can represent a company, an asset, an ownership structure or another complex system.
This opens the possibility of creating a digital counterpart of a corporate structure that can be investigated interactively.
Instead of merely reading that Company A owns 60 percent of Company B, which owns 40 percent of Company C, the relationships can become part of an interactive model. The analytical object is no longer just the individual data point but the structure formed by the data points and their relationships.
Multiple Datasets in One Space
A particularly important feature is the ability to combine different datasets within the same environment.
Financial information is rarely contained in one perfectly integrated source. Ownership information, financial statements, market data, transaction information and other corporate data may originate from different systems.
When these datasets are displayed separately, identifying relationships requires considerable cognitive effort. Bringing them together into one spatial environment can make relationships between different categories of information more apparent.
The innovation therefore lies partly in the integration of perspectives. The spatial environment can become a common interface through which different datasets are viewed simultaneously.
Collaboration Becomes Part of the Analysis
Perhaps the most significant difference from conventional 3D visualization is the collaborative dimension.
Data2Space is designed so that several people can work in the same information space. They can investigate data from different perspectives, identify findings, discuss relationships and develop a common interpretation.
This changes the role of visualization in decision-making. A chart is normally something that people look at together. A shared spatial environment is something they can actively explore together.
For investment committees, due-diligence teams, consultants, analysts and management teams, this could be particularly valuable. The spatial model becomes a shared reference point for discussion.
Beyond Screen Sharing
This also distinguishes Data2Space from conventional remote collaboration.
Screen sharing allows several people to see the same screen. But normally one person controls the presentation while everyone else observes.
In a shared Data2Space environment, the participants can interact with the information itself. The distinction is comparable to the difference between watching a map and entering an interactive map in which every participant can independently investigate locations and relationships.
This creates the possibility of a genuinely shared analytical environment rather than simply a shared presentation.
Hardware Independence
Another aspect that makes the approach distinctive is its cross-platform orientation.
Data2Space is intended to work across desktop, web and immersive XR devices. This is strategically important because professional users will not necessarily have the same hardware.
One person may prefer a conventional monitor, another may use a browser, while another may enter the same information environment through an XR headset.
The spatial information model therefore does not have to be tied to one particular device. The space becomes the common denominator, while the hardware becomes the access point.
From Individual Analysis to Common Understanding
The deeper innovation of Data2Space can consequently be described as a shift from individual data consumption toward shared spatial understanding.
Financial professionals often possess the same underlying information but interpret it differently because each person sees only part of the structure. By placing the information into a common spatial model, Data2Space aims to create a shared cognitive environment.
This is particularly relevant when decisions depend on relationships rather than isolated numbers. Whether evaluating a company, conducting due diligence, analyzing an investment portfolio, examining ownership structures or discussing a transaction, the central question is often not simply “What is the number?” but “How is this number connected to everything else?”
A New Layer Between Data and Decision
Data2Space therefore occupies an interesting position between data infrastructure, visualization and decision support.
It does not necessarily replace the underlying databases, spreadsheets or financial systems. Instead, it adds an interactive spatial layer through which their information can be explored.
That may ultimately be the most important innovation: Data2Space is not primarily attempting to make existing charts three-dimensional. It is attempting to change the interface between complex information and the people who have to understand it.
The transition is from documents to spaces, from visualization to exploration, from isolated analysis to collaboration, and from screen sharing to shared interaction.
If successful, this approach could establish spatial information environments as a new category of professional financial technology. The objective is not to put finance into virtual reality simply because the technology makes it possible. The objective is to use space as an additional analytical dimension—so that complex financial structures can be seen, navigated, discussed and understood as interconnected systems.
That is what makes Data2Space different: the innovation is not 3D alone. It is the creation of a shared, interactive and platform-independent space in which data itself becomes the environment for analysis and decision-making.















Leave a Reply