
Financial information can be presented in many different ways. A financial analyst can describe a situation in prose, summarize its characteristics in a list, organize its components in a table, or illustrate relationships in a two-dimensional diagram. Each representation has its own advantages, and each can communicate important aspects of a financial decision. Yet when financial information becomes highly interconnected, the question is no longer simply how to present the data. It is how to enable people to understand the relationships between the data, recognize hidden dependencies, and evaluate the consequences of their decisions.
Three-dimensional visualization represents an important step forward in this development. However, even a three-dimensional image displayed on a conventional screen does not exploit the full potential of spatial representation. The greatest opportunity emerges when users can enter a three-dimensional environment, move around a financial model, examine it from different perspectives, and interact with its components. Extended Reality (XR), encompassing technologies such as virtual reality and mixed reality, makes this possible.
The fundamental argument is that the highest potential for insight arises when financial information is not merely displayed in three dimensions but becomes accessible as a spatial environment in which people can explore, compare, and investigate relationships themselves.
This does not mean that immersive visualization is automatically superior for every financial task. A spreadsheet remains an excellent tool for precise calculations, a table may be the most efficient way to compare interest rates, and a two-dimensional chart can communicate a financial trend with exceptional clarity. The advantage of spatial XR becomes particularly significant when the challenge lies in understanding complex structures, integrating multiple perspectives, and recognizing relationships that are difficult to reconstruct from separate representations.
To understand why, it is useful to examine the same financial situation through progressively more sophisticated forms of representation.
One Financial Decision, Five Levels of Representation
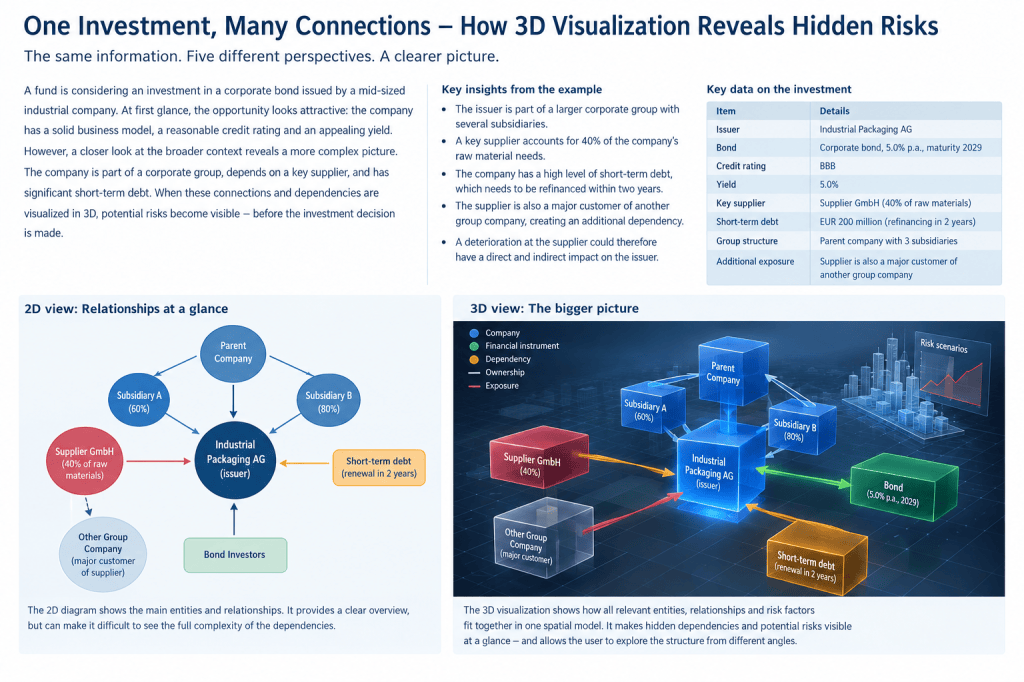
Consider a fund manager evaluating a corporate bond issued by a hypothetical industrial company, Industrial Packaging AG. The bond offers an annual yield of 5 percent and matures in 2029. At first glance, the investment appears attractive: the company operates in an established market, its credit rating is investment grade, and its yield seems competitive.
A closer examination reveals a more complicated situation.
Industrial Packaging AG belongs to a corporate group with several subsidiaries. Forty percent of its raw material requirements come from a single supplier, Supplier GmbH. The issuer also has EUR 200 million in short-term debt that must be refinanced within two years. In addition, Supplier GmbH is a major customer of another company within the same corporate group.
These facts create several potential vulnerabilities. A deterioration in the supplier’s financial position could affect the issuer’s production. The supplier’s difficulties could also affect another company in the group through the commercial relationship between them. Meanwhile, the issuer’s refinancing requirements could become more difficult to manage if operating performance deteriorates.
The investment decision therefore depends on more than the bond’s yield, maturity, and credit rating. It requires an understanding of the relationships between the issuer, its corporate group, its supplier, its financing arrangements, and the potential transmission of financial stress.
The same information can be represented in five different ways.
1. Prose: Explaining the Situation Through Language
In a written analysis, the financial situation can be described in a coherent narrative.
Industrial Packaging AG offers a corporate bond with a 5 percent annual yield and a maturity in 2029. Although its current credit rating and operating profile appear satisfactory, the company depends on Supplier GmbH for 40 percent of its raw material requirements and must refinance EUR 200 million in short-term debt within two years. Supplier GmbH is also a major customer of another company in the issuer’s corporate group. Consequently, financial difficulties affecting the supplier could potentially influence both the issuer’s production and the performance of another group company, while refinancing pressures could amplify the consequences of an operational disruption.
This narrative provides context and explains why the investment deserves closer examination.
Language is particularly effective at communicating causality, qualifications, and uncertainty. It enables an analyst to distinguish established facts from assumptions and explain why a relationship matters.
However, the reader must construct a mental model of the situation. The relationship between the supplier, the issuer, the corporate group, and the refinancing requirement exists primarily in the reader’s imagination.
As the number of entities and relationships increases, maintaining a coherent mental representation becomes more difficult. The reader may understand each statement individually without fully appreciating the combined structure.
2. A List: Identifying the Relevant Risk Factors
The same situation can be expressed as a list:
- Investment instrument: Corporate bond issued by Industrial Packaging AG.
- Yield: 5 percent annually.
- Maturity: 2029.
- Credit rating: Investment grade.
- Supplier concentration: Supplier GmbH provides 40 percent of raw materials.
- Refinancing exposure: EUR 200 million in short-term debt must be refinanced within two years.
- Group dependency: Supplier GmbH is also a major customer of another group company.
- Potential consequence: Financial difficulties at the supplier could affect several connected businesses.
This format improves accessibility. The reader can identify the relevant facts quickly, check whether important information is missing, and use the list as a checklist during a credit assessment.
Nevertheless, a list primarily communicates the existence of individual factors. It does not inherently show how those factors influence one another.
The supplier concentration, refinancing exposure, and group dependency appear as separate entries. Their combined significance must still be inferred.
The list is therefore useful for identifying risks, but less effective at revealing the architecture of those risks.
3. A Table: Organizing Information for Comparison
A table provides another improvement by assigning information to structured categories.
| Component | Financial information | Potential significance |
|---|---|---|
| Corporate bond | 5% annual yield, maturity in 2029 | Potential investment return |
| Industrial Packaging AG | Bond issuer | Primary object of credit assessment |
| Supplier GmbH | Supplies 40% of raw materials | Supplier concentration risk |
| Short-term debt | EUR 200 million, refinancing within two years | Refinancing and liquidity risk |
| Other group company | Major customer of Supplier GmbH | Additional commercial dependency |
| Corporate group | Parent company and subsidiaries | Possible channels for transmitting financial stress |
The table makes it easier to compare facts, categories, and potential consequences. It also provides a useful basis for structured analysis, due diligence, and documentation.
Yet the relationships remain implicit in the arrangement of rows and columns.
The table does not automatically communicate how a disruption at Supplier GmbH could propagate through the corporate group or how that disruption might coincide with the issuer’s refinancing needs. A reader must mentally connect the entries.
This limitation becomes more important when dozens or hundreds of entities are involved.
4. A Two-Dimensional Diagram: Making Connections Visible
A two-dimensional network diagram can represent the issuer, its parent company, subsidiaries, supplier, and financial obligations as nodes connected by lines or arrows.
Ownership relationships can be represented with one type of line, commercial dependencies with another, and financing relationships with a third. Color, shape, and labels can distinguish different categories.
The diagram makes an important contribution: relationships that were previously described in words or distributed across a table become visible.
The viewer can immediately identify the supplier’s connection to the issuer and the other group company. The refinancing requirement can be placed alongside these relationships, drawing attention to the possibility that operational and financial pressures might coincide.
A two-dimensional diagram therefore reduces the effort required to reconstruct the network mentally.
However, it still presents the network on a flat surface. As the number of entities and connections increases, lines may overlap, labels may become difficult to read, and different categories of relationships may compete for attention.
Large diagrams can become crowded, particularly when ownership, financing, contractual relationships, risk exposures, and scenario outcomes must all be represented simultaneously.
There is also a fundamental limitation: although the diagram represents relationships, the user remains outside the represented structure, looking at it from a fixed position.
The information is visible, but the possibilities for spatial exploration remain restricted.
5. An Immersive Three-Dimensional XR Environment: Entering the Financial Structure
In an immersive XR environment, the same financial situation can become a spatial model.
Industrial Packaging AG can be represented as a central object. Its parent company and subsidiaries occupy connected positions around it. Supplier GmbH is positioned according to its commercial relationship with the issuer and its connection to the other group company. The corporate bond and short-term debt are represented as distinct financial objects.
Ownership, financing, and commercial relationships can be displayed through different visual connections. Additional attributes can be revealed when a user approaches, selects, or interacts with an object.
The fund manager is no longer limited to looking at a representation from a fixed position. The user can move around the model, approach individual entities, inspect connections from different angles, and change the perspective to investigate specific questions.
The manager might first examine the corporate group from above to understand its overall structure. The user could then move closer to Industrial Packaging AG to inspect its financing profile, follow the supplier relationship, and investigate how a hypothetical disruption might affect connected companies.
A risk scenario could be activated to show the possible consequences of a supplier disruption. The visualization might highlight the issuer’s exposure, identify the other group company connected to the supplier, and display the additional pressure created by the approaching refinancing requirement.
The crucial difference is not simply that the information is three-dimensional.
The difference is that the user can explore the information through spatial movement, interaction, and changes of perspective.
The financial structure becomes an environment for investigation rather than an image to be inspected.
Why Spatial XR Can Generate Greater Insight
The potential advantage of immersive visualization becomes clearer when we consider several characteristics of human understanding and financial analysis.
1. Spatial relationships can make abstract dependencies more intuitive
Financial relationships are abstract. Ownership percentages, debt obligations, commercial dependencies, and cash flows do not naturally occupy physical space.
Yet spatial representations can provide a comprehensible structure for these abstractions.
A parent company can be positioned above its subsidiaries. Financial obligations can be represented as connections between borrowers and lenders. Supplier dependencies can be shown as links between operational entities. Risk exposures can be displayed as additional layers within the same environment.
These spatial arrangements do not need to imitate physical reality. Their purpose is to establish a consistent visual language that helps users distinguish and understand different kinds of relationships.
Once users understand the conventions, they can interpret the structure through a combination of visual recognition and active exploration.
The value lies in making the relationships easier to perceive, not in suggesting that the financial system literally exists in the same form as the visualization.
2. Multiple perspectives support different analytical questions
A financial network does not have one universally correct viewpoint.
A credit analyst may want to examine the issuer’s dependencies. An investment manager may focus on the relationship between yield and risk. A group risk manager may be interested in the transmission of financial distress between subsidiaries. A restructuring specialist may concentrate on debt maturities and refinancing options.
A conventional diagram generally requires the designer to choose a layout that balances these different needs.
An immersive environment can allow users to change their viewpoint according to the question they are investigating.
In the Industrial Packaging AG example, the fund manager could examine the corporate group from a broad perspective, then move closer to the issuer and inspect its relationships with Supplier GmbH and its financing arrangements.
The user could also examine the structure from the supplier’s perspective, revealing that Supplier GmbH is connected not only to the issuer but also to another group company.
This change of perspective may reveal relationships that are less apparent when the analysis is organized exclusively around the bond issuer.
The ability to explore multiple perspectives is particularly valuable because financial misjudgments often result from considering a situation from only one analytical standpoint.
3. Spatial separation can reduce visual congestion
A complex financial diagram can contain hundreds of nodes and thousands of connections. If every relationship is displayed on a single plane, the resulting image may become difficult to interpret.
Three-dimensional environments provide an additional dimension in which information can be organized.
Entities can be separated spatially according to their role, corporate affiliation, financial function, or position in a network. Different layers can represent ownership, financing, commercial dependencies, and scenario outcomes.
This can help users focus on one aspect of the structure without losing access to the wider context.
For example, the corporate group could occupy one region of the environment, financing relationships another, and external commercial dependencies a third. Connections between these regions would remain visible, allowing users to understand how the different structures interact.
Spatial separation does not eliminate complexity. A poorly designed 3D model can be just as confusing as a crowded two-dimensional diagram, and additional dimensions can introduce occlusion and navigation problems.
The benefit therefore depends on thoughtful spatial organization, meaningful interaction, and appropriate control over the amount of information displayed.
4. Active exploration encourages analytical questions
A static representation communicates what its designer has chosen to display.
An interactive spatial environment allows the user to investigate beyond that initial presentation.
In the bond example, the fund manager might ask:
- What happens if Supplier GmbH cannot deliver raw materials?
- Which other companies are exposed to the supplier?
- How important is the issuer’s refinancing requirement if operating cash flow declines?
- Does the corporate group have sufficient financial flexibility to support a distressed subsidiary?
- Which assumptions determine the severity of the downside scenario?
The user can select relevant entities, inspect their attributes, reveal additional relationships, and activate alternative scenarios.
This transforms the visualization into an interface for asking questions.
The distinction is important because the prevention of financial misjudgments requires more than receiving information. It requires the ability to challenge assumptions, examine alternative explanations, and investigate potentially adverse outcomes.
An immersive environment can support this process by making relevant information accessible through direct interaction.
However, the quality of the insights still depends on the data, analytical methods, and questions brought to the model. Interaction alone does not guarantee better judgment.
5. The same spatial environment can integrate different forms of financial information
Financial decisions often require the integration of quantitative data, qualitative assessments, contractual relationships, and forward-looking assumptions.
A bond analysis, for example, might include financial statements, maturity profiles, credit ratings, management assessments, ownership information, and supplier dependencies.
These information types are often distributed across different applications and documents.
A spatial XR environment can bring them together in a common representation without requiring every detail to remain visible simultaneously.
The central object might represent Industrial Packaging AG. Selecting it could reveal its financial indicators. Approaching the debt object could open a maturity profile. Following a connection to Supplier GmbH could reveal the supplier’s contribution to raw material requirements and its relationships with other group companies.
The user moves from an overview to specific evidence and back again.
This combination of spatial context and access to detailed information can help bridge the gap between understanding the overall structure and examining the evidence behind individual conclusions.
The objective is not to replace financial statements or analytical models with spatial objects. It is to connect these sources of information through an interface that helps users understand how they relate.
6. Immersion can improve collaborative analysis
Many important financial decisions involve several professionals with different responsibilities and areas of expertise.
A credit analyst may understand the issuer’s financial position. An industry specialist may have a better understanding of the supplier market. A portfolio manager may be concerned with the investment’s contribution to overall portfolio risk. A restructuring expert may focus on refinancing alternatives.
When each participant works with separate reports and diagrams, a substantial part of the discussion may be spent establishing a common understanding of the situation.
A shared XR environment can provide a common reference point.
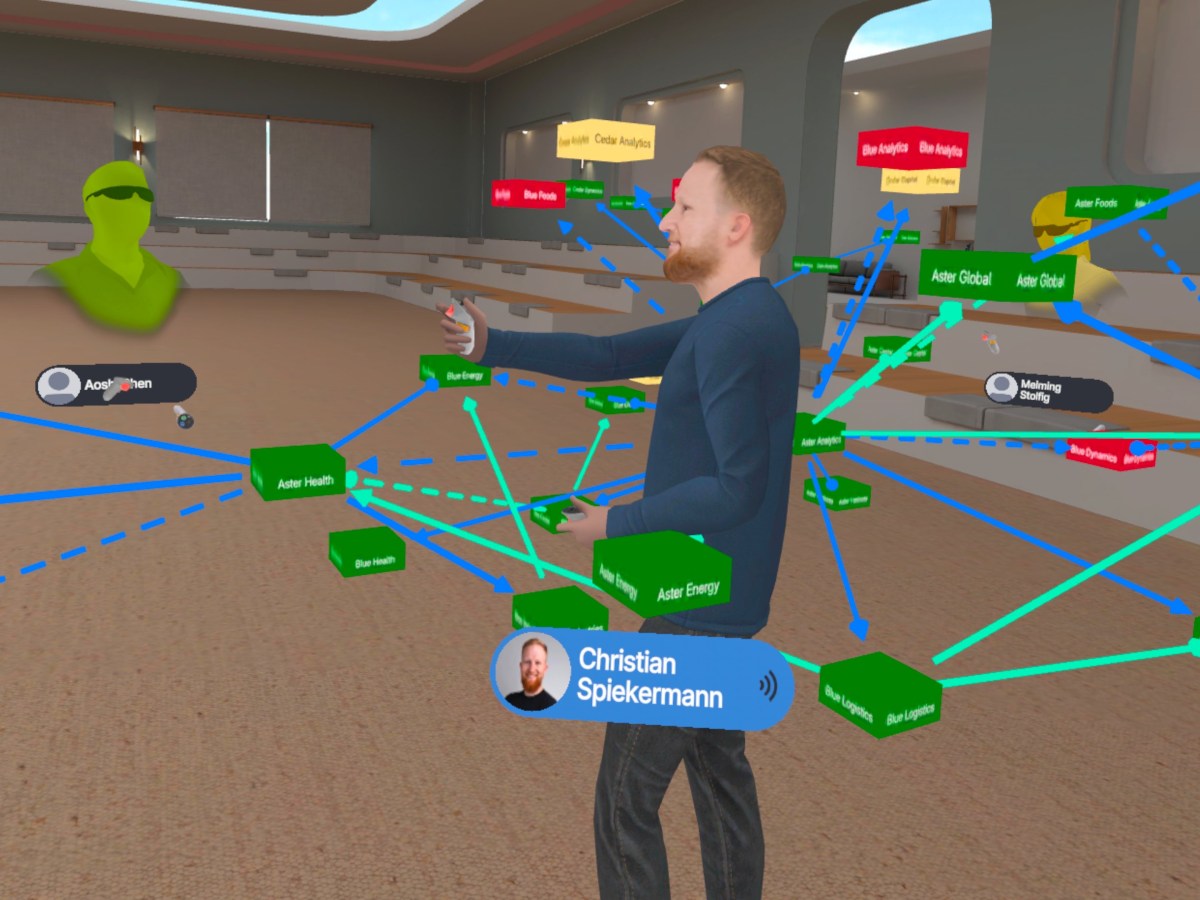
Participants can examine the same corporate structure, select the same financial relationships, and discuss the same scenario. One person can draw attention to the supplier dependency while another investigates its implications for refinancing.
The shared environment can make disagreements more concrete. Instead of debating an abstract statement, participants can examine the relevant entities, connections, assumptions, and evidence together.
This may improve the quality of deliberation, particularly when a decision depends on integrating different forms of expertise.
Nevertheless, the effectiveness of collaborative XR depends on accessibility, usability, and the ability to accommodate participants who do not use immersive hardware. A well-designed system should support appropriate desktop or conventional-screen access as well.
Why 3D on a Screen Is Not the Same as 3D in XR
An important distinction must be made between a three-dimensional visualization displayed on a conventional monitor and a three-dimensional environment experienced through spatial computing.
A monitor can display perspective, depth cues, shadows, lighting, and three-dimensional objects. These techniques can create a compelling impression of depth.
However, the viewer still observes the scene from a limited viewpoint determined by the display.
In an immersive XR environment, the user can experience stereoscopic depth and change the viewpoint through natural head and body movement. Depending on the system, the user can also move through the environment, reach toward objects, manipulate representations, and collaborate with other participants.
These differences affect how the user interacts with the information.
| Capability | 2D presentation | 3D visualization on a screen | Immersive spatial XR |
|---|---|---|---|
| Present financial facts | Yes | Yes | Yes |
| Show relationships between entities | Through text, tables, or diagrams | Through spatial objects and connections | Through spatial objects and connections |
| Represent depth | Limited to visual conventions | Simulated depth | Stereoscopic depth and spatial perspective |
| Change viewpoint | Usually limited | Often possible through rotation and zoom | Natural head movement and spatial navigation |
| Explore a large structure | Through scrolling, filtering, or multiple views | Through rotation, zoom, and navigation | Through movement, viewpoint changes, and interaction |
| Inspect selected entities | Through links, menus, or drill-downs | Through interactive controls | Through spatial selection and interaction |
| Collaborate around a shared model | Through documents and screens | Through shared applications | Through a shared spatial environment, where supported |
| Potential to support intuitive spatial understanding | Depends on the design | Higher when spatial relationships are meaningful | Potentially highest when immersion and interaction improve the task |
The distinction between the final two columns is especially important.
A three-dimensional model on a monitor can already provide substantial benefits. For some analytical tasks, it may be entirely sufficient.
XR adds the possibility of experiencing the model as a surrounding environment rather than viewing it through a rectangular frame. This can make spatial exploration more natural, particularly when the model is large, contains many interconnected entities, or benefits from examining relationships at different scales.
Yet immersion is not itself evidence of superior analytical performance. Some users may understand a structure more effectively on a screen, especially when precise numerical comparisons, rapid navigation, or simultaneous inspection of multiple charts is required.
The relevant question is therefore not whether XR is inherently better than a monitor. It is whether spatial interaction makes a particular financial task easier, more accurate, or more comprehensive.
The Importance of Spatial Design: More Than Placing Objects in a Room
A common misconception is that converting financial information into 3D simply means placing existing charts and diagrams into a virtual environment.
Such an approach may create a visually impressive presentation without generating additional insight.
To realize the potential of XR, the spatial arrangement must communicate meaningful information.
The position of an object should have a clear purpose. Connections should represent identifiable relationships. Visual differences should convey consistent categories or attributes. Navigation should support the questions that users need to investigate.
For example, a corporate group could be arranged according to ownership relationships, with subsidiaries positioned relative to their parent company. Financing relationships could be represented through a distinct visual system. Commercial dependencies could form another layer, while scenario analysis could reveal potential channels through which financial stress might propagate.
The user should be able to understand the basic structure without reading every label, while still being able to access the underlying evidence.
This requires a balance between overview and detail.
At the overview level, the model should communicate the structure of the financial situation. At closer range, it should provide access to specific data, assumptions, and relationships. When the user changes perspective, the model should preserve enough context to prevent disorientation.
The best spatial arrangement is not necessarily the one that resembles the physical world. It is the one that most effectively supports the analytical task.
A financial network, for example, may be arranged to make ownership hierarchies clear even if that arrangement does not correspond to geographical locations. A financing model may place debt instruments close to the entities whose obligations they represent. A scenario view may emphasize the sequence through which a potential disruption could spread.
In each case, spatial design serves a cognitive purpose.
From Seeing a Risk to Understanding Its Consequences
The distinction between visual recognition and genuine understanding deserves particular attention.
Suppose the fund manager notices that Industrial Packaging AG depends heavily on Supplier GmbH. The visualization has successfully made a relationship visible.
However, identifying the relationship is only the first step.
The manager must then investigate whether the supplier’s position creates a material risk, how likely a disruption might be, what alternatives the issuer has, and how the consequences would interact with the refinancing requirement.
A useful XR environment should support this progression from observation to investigation.
The user might select Supplier GmbH to inspect its role in the supply chain. The system could then reveal that the supplier accounts for 40 percent of the issuer’s raw material requirements and is also a major customer of another group company.
A scenario could illustrate how a supplier disruption might affect the issuer’s production and the other company’s commercial position. The manager could then examine how lower operating cash flow might interact with the approaching debt refinancing.
Importantly, the visualization should distinguish between established facts and hypothetical outcomes.
The supplier’s 40 percent contribution might be a documented fact. A future disruption would be a scenario. The estimated financial impact would depend on assumptions about alternative suppliers, inventory, prices, production, and the duration of the disruption.
The spatial representation should make these distinctions clear rather than presenting all objects and connections as equally certain.
The ultimate objective is to help the analyst construct a defensible explanation of the risk, supported by evidence and explicit assumptions.
The Role of AI: From Automated Analysis to Human Examination
Artificial intelligence can extend the capabilities of immersive financial analysis.
AI systems can help process large volumes of financial information, extract relationships from documents, identify anomalies, detect patterns, and generate potential risk scenarios. These capabilities may reveal connections that would be difficult for an analyst to identify manually.
Spatial visualization can then provide an interface through which these results can be examined.
In the Industrial Packaging AG example, an AI system might identify the combination of supplier concentration, group dependency, and refinancing exposure as a potential source of elevated risk.
The XR environment could make the underlying relationships visible, allowing the fund manager to inspect the evidence supporting the AI-generated assessment.
The manager could question whether the supplier dependency is as critical as the system suggests, investigate alternative supply arrangements, and assess whether the group’s financial resources provide sufficient protection against a disruption.
This creates a productive division of responsibilities.
AI can assist with discovering and analyzing patterns across large datasets. Spatial visualization can help communicate the relationships involved. Human experts can examine the evidence, challenge assumptions, evaluate uncertainty, and make the final decision.
This approach is particularly important in credit analysis and investment management, where the consequences of a decision may be substantial and where analytical outputs should not be accepted uncritically.
The visualization must not turn uncertain AI-generated conclusions into apparently objective spatial facts. Every important claim should remain traceable to its data sources, analytical assumptions, and level of uncertainty.
The value of XR lies in making complex analytical results more accessible to human judgment, not in replacing judgment with a convincing visual experience.
Measuring Whether XR Actually Improves Financial Decisions
The argument for immersive visualization should ultimately be evaluated through evidence.
A sophisticated 3D environment may be technically impressive, but its business value depends on whether it helps users perform relevant tasks more effectively.
Financial institutions could test the same analytical problem using five representations: prose, a list, a table, a two-dimensional diagram, and an immersive three-dimensional environment.
Participants could be asked to identify critical dependencies, detect potential concentrations of risk, explain how a disruption might propagate through a corporate group, and assess the implications for an investment decision.
The evaluation could examine several dimensions:
- Accuracy: Do users identify the relevant risks and relationships correctly?
- Completeness: Do they recognize important dependencies that might otherwise be overlooked?
- Efficiency: How long does it take them to understand the structure and reach a defensible assessment?
- Reasoning quality: Can they explain why a relationship matters and how it affects their conclusion?
- Scenario understanding: Can they identify the potential consequences of alternative assumptions?
- Decision consistency: Do different analysts reach more comparable conclusions when working from the same evidence?
It would also be important to measure potential disadvantages, including cognitive overload, navigation difficulties, user fatigue, and the time required to learn the system.
Results should be compared across users with different levels of experience and spatial familiarity. An interface that works exceptionally well for one group may be less effective for another.
Such testing can help establish where immersive visualization delivers measurable benefits and where conventional analytical tools remain preferable.
It may also reveal that the strongest solution is a combination of representations rather than the exclusive use of one format.
A financial professional might begin with a table to check numerical values, use a two-dimensional diagram to obtain an overview, and enter an XR environment to investigate complex dependencies. The results could then be documented in a conventional report.
In this workflow, each representation contributes something different.
The objective is not to replace every established tool with XR. It is to use spatial visualization where it provides the greatest additional value.
Why This Matters for the Future of Financial Decision-Making
Financial systems are becoming increasingly interconnected. Corporate groups operate across jurisdictions, supply chains span multiple markets, and financial instruments create relationships between institutions, investors, borrowers, and counterparties.
At the same time, AI is increasing the volume and complexity of information available for analysis.
The resulting challenge is not simply how to process more data. It is how to preserve human understanding as the number of relevant relationships grows.
Traditional financial representations remain indispensable, but they may become insufficient when decision-makers must integrate many interacting dimensions simultaneously.
Three-dimensional visualization can help address this challenge by providing a spatial framework for complex information. Immersive XR extends this framework by allowing users to explore the represented structure directly, changing perspectives and investigating relationships in a shared environment.
For credit rating agencies, investment managers, banks, and corporate decision-makers, this creates opportunities to make complex financial assessments more transparent and more accessible to critical examination.
The most important benefits may arise not from displaying more information, but from helping users discover connections they did not initially recognize.
A dependency that appears insignificant in isolation may become important when viewed alongside financing obligations and group relationships. A seemingly attractive investment may deserve reconsideration when its exposure to a common source of risk becomes visible. An AI-generated conclusion may become easier to evaluate when the underlying relationships can be inspected directly.
These are the kinds of insights that can help prevent financial misjudgments.
Conclusion: The Highest Insight Potential Lies in Spatial Exploration
Prose explains a financial situation. A list organizes its components. A table facilitates comparison. A two-dimensional diagram makes relationships visible. A three-dimensional model introduces depth and additional possibilities for spatial organization.
An immersive XR environment goes one step further: it allows the user to explore the financial structure as a space.
That difference matters because understanding complex financial systems is not merely a matter of reading individual facts. It requires recognizing how those facts relate to one another, identifying dependencies, examining alternative perspectives, and understanding how potential changes could affect the wider system.
In the Industrial Packaging AG example, the decisive insight does not come from the bond’s 5 percent yield alone, nor from the issuer’s credit rating, supplier concentration, or refinancing requirement considered separately. It emerges from understanding how these factors interact and how financial stress could propagate through the connected corporate structure.
A spatial XR environment can make these relationships accessible for direct investigation. It allows the user to move from an overview to specific entities, examine connections from different viewpoints, and explore potential consequences while retaining the broader context.
This does not guarantee better decisions. The quality of the outcome still depends on the data, analytical methods, spatial design, and expertise of the people involved.
Nevertheless, immersive spatial computing offers a compelling direction for financial analysis: moving from the passive presentation of information toward the active exploration of relationships.
The highest potential for insight lies not simply in seeing financial data in three dimensions, but in being able to enter its structure, explore its relationships, and challenge its implications from within a spatial environment.
When that capability helps a decision-maker recognize a critical dependency, question an unsupported assumption, or identify a risk before capital is committed, 3D visualization becomes more than a new way to display financial information. It becomes a practical instrument for strengthening human judgment.

















Leave a Reply